TJHSST Offers Admission to 550 Students; Broadens Access to Students Who Have an Aptitude for STEM
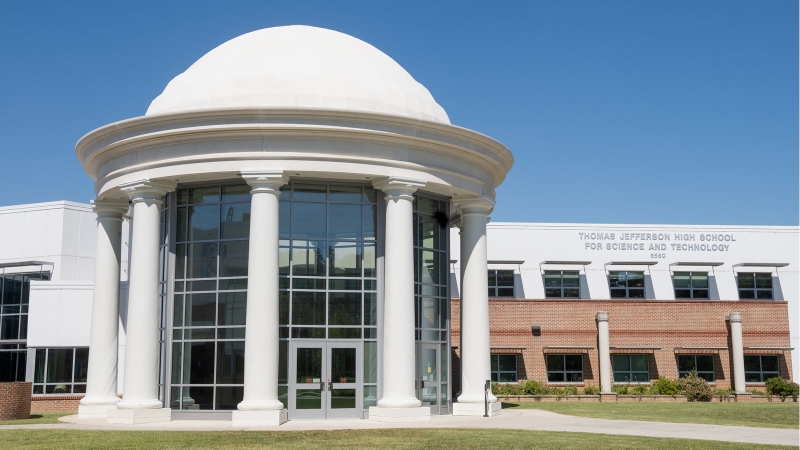
Thomas Jefferson High School for Science and Technology (TJHSST), a Governor's School within Fairfax County Public Schools that is regularly ranked as one of the top public schools in the country, has offered admission to 550 students for the Class of 2025.
This is the first class to apply under the revised admissions process which eliminated the standardized admissions test for TJHSST, eliminated the $100 application fee, raised the minimum GPA, and expanded the freshman class from 480 to 550. Seats in the TJHSST freshman class were also allocated for the top 1.5% of applicants from every middle school.
For the first time in at least 10 years, every FCPS middle school has students who were offered admission to TJHSST. The students accepted for the Class of 2025 are high performers and are well prepared for the school’s academic rigor. At 3.9, the average GPA for applicants is higher this year than it has been in the past five years. The average GPA for students offered admission remains extremely high at more than 3.95.
Last fall’s changes to the TJHSST admissions process also resulted in a significant increase in access for groups who have faced barriers to entry, including special education students, students eligible for free and/or reduced-price meals, and English Learners. (See chart below.)
Superintendent Scott S. Brabrand said, “Last year, Fairfax County Public Schools moved to ensure increased access and opportunity to TJ for students with an aptitude and passion for STEM. The data around TJ’s prospective freshmen class speaks volumes to the fact that when we truly center our work on equity, all of our students have an opportunity to shine.”
The new admissions process continues to be merit based and is race blind. Students are allocated a number by which to be identified during the process. Admissions evaluators do not know the race, ethnicity, or gender of any applicant.
Established in 1985, Thomas Jefferson High School for Science and Technology is a Governor’s School, emphasizing the sciences, mathematics, and technology. The school’s mission is to provide students with a challenging learning environment focused on math, science, and technology; to inspire joy at the prospect of discovery; and to foster a culture of innovation based on ethical behavior and the shared interests of humanity.
###
For information regarding admissions, please contact the TJHSST Admissions Office at [email protected] or 571-423-3770. Members of the media may contact Julie Moult, [email protected], 571-395-7398 or Kathleen Miller, [email protected], 571-286-6523.
TJHSST Admissions Data, Class of 2025
Increase in Applications
- FCPS staff stepped up outreach efforts to encourage students to apply.
- TJ Admissions received 3,034 applications for enrollment in the 2021-22 school year v. 2,539 applications in 2020-21--a 17% increase.
Merit Based
- The average GPA for applicants (3.9074) is slightly higher this year than it has been in the past five years.
- The average GPA for students offered admission (3.9539) is in line with previous years.
- Accepted students are high performers and are well prepared for TJ’s academic rigor.
Increased Diversity
- In the last 10 years, this is the first time all FCPS middle schools had students who were accepted into TJ.
- Economically disadvantaged students increased from 0.62% (2020-21) to 25.09%.
- 2.36% of accepted students are special education students.
- 7.09% of accepted students are English Language Learners.
- Female students increased from 41.80% (2020-21) to 46.00%.
- Black students increased from 1.23% (2020-21) to 7.09%.
- Hispanic students increased from 3.29% (2020-21) to 11.27%.
- White students increased from 17.70% (2020-21) to 22.36%.
- Asian students continue to constitute a majority of the class at 54.36%, a decrease from 73.05% (2020-21).
Class of 2025
| Avg. of Apps | Avg. of Offers | |||
|---|---|---|---|---|
| GPA | 3.9074 | 3.9539 | ||
| Experience Factors | # of Apps. | % of Apps. | # of Offers | % of Offers |
| ELL (FCPS Only) | 89 | 2.93% | 30 | 5.45% |
| English Language Learners (All) | 124 | 4.09% | 39 | 7.09% |
| Special Education | 47 | 1.55% | 13 | 2.36% |
| Economically Disadvantaged | 387 | 12.76% | 138 | 25.09% |
| Gender | # of Apps. | % of Apps. | # of Offers | % of Offers |
| Male | 1,563 | 51.52% | 297 | 54.00% |
| Female | 1,471 | 48.48% | 253 | 46.00% |
| Total | 3,034 | 550 | ||
| Race/Ethnicity | # of Apps. | % of Apps. | # of Offers | % of Offers |
| Asian | 1,535 | 50.59% | 299 | 54.36% |
| Black (Not Hispanic orig) | 272 | 8.97% | 39 | 7.09% |
| Hispanic | 295 | 9.72% | 62 | 11.27% |
| White (Not Hispanic orig) | 726 | 23.93% | 123 | 22.36% |
| Multiracial/Other* | 206 | 6.79% | 27 | 4.91% |
| Total | 3,034 | 550 | ||
| School Type | # of Apps. | % of Apps. | # of Offers | % of Offers |
| Public | 2,887 | 95.15% | 535 | 97.27% |
| Private/Home | 147 | 4.85% | 15 | 2.73% |
| Total | 3,034 | 550 | ||
| TJHSST Applicant Schools | Total | Underrepresented Schools | Underrepresented Schools (FCPS) | |
| Schools | 130 | 26 | 10 |
*This category includes students who check "Multiracial" on their application and/or students whose ethnic designation numbered ten or fewer.
For TJHSST admissions data in the past five years, view previous news releases:
FOR MEDIA ONLY: Available video footage of Superintendent Brabrand for immediate use in media coverage. (Please credit Fairfax County Public Schools):
