Benchmarking Data for Students at the Start of the 2021-22 School Year
Summary
iReady assessments measure students’ reading ability and math ability. FCPS uses this data primarily to identify students in need of interventions. iReady assesses student performance according to the level they should meet by the end of the school year. Students are not expected to meet these expectations at the beginning of the school year.
iReady is given in the fall and again in the spring. This practice provides a growth measure. The goal is to have all students at or above the grade-level expectation by the end of the school year.
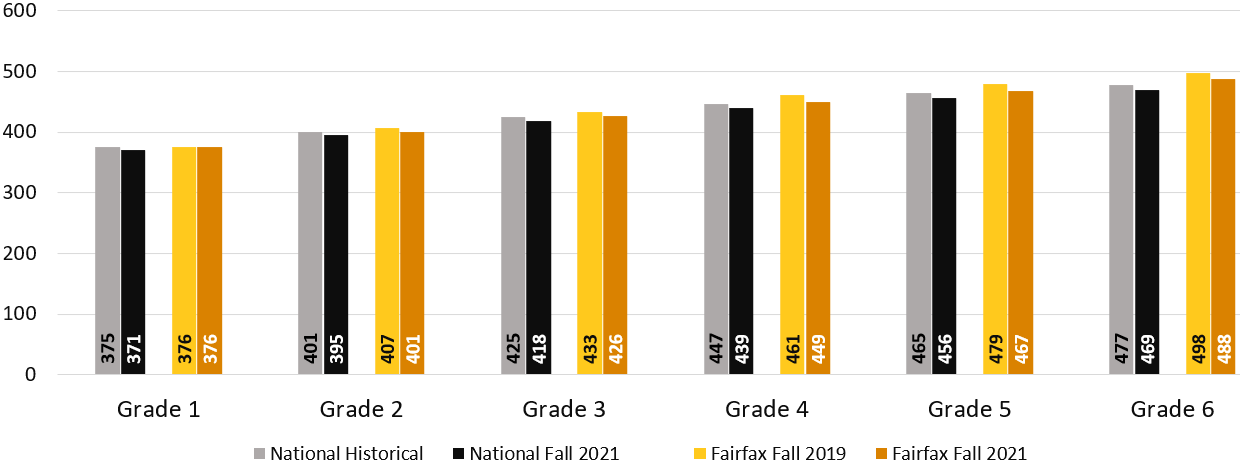
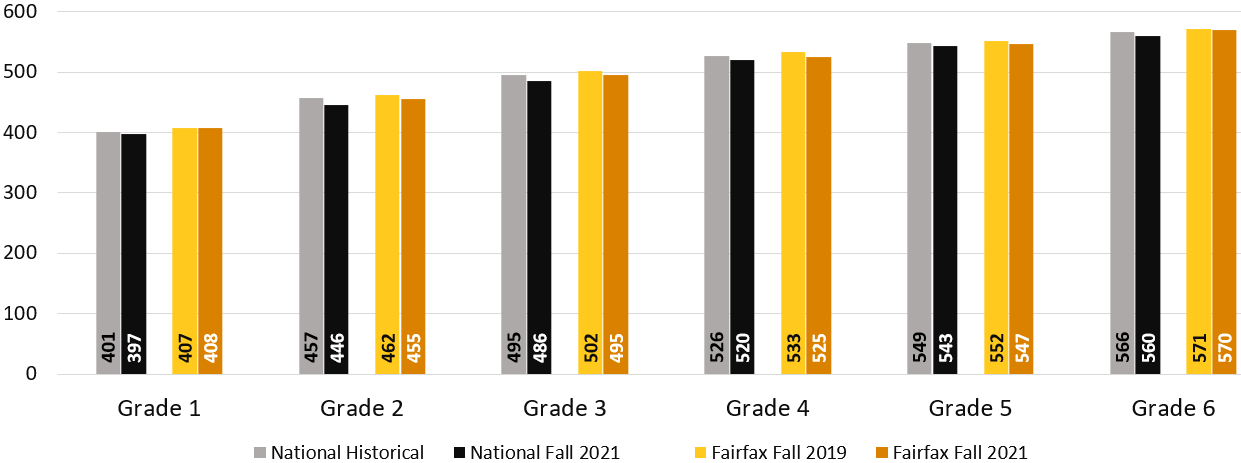
Given the 18 months of disrupted learning caused by the pandemic, FCPS expected to see a decline in performance across all grades. While this proves true when looking at iReady mean scaled scores in grades 2-6, declines in FCPS are generally less substantial than were seen nationwide pre- and post-pandemic.
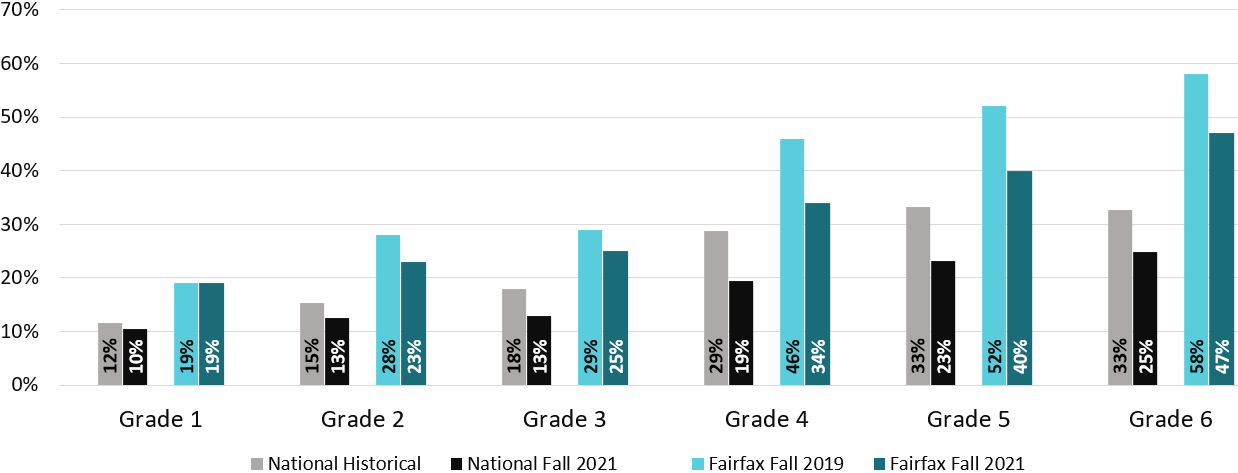
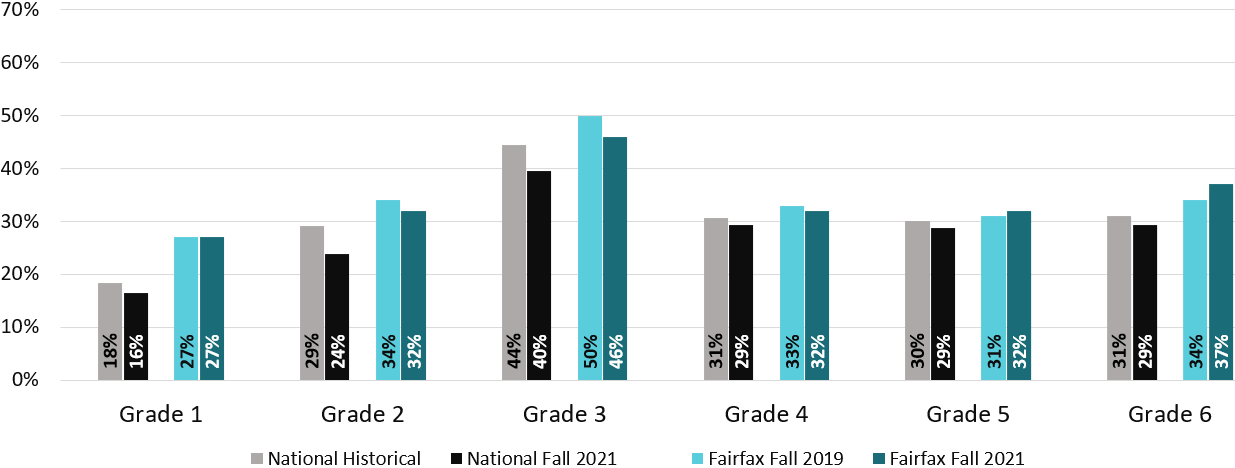
Even after the pandemic, FCPS showed more students performing on grade level on the fall iReady assessment than the pre-pandemic national averages in both reading and math in all grade levels.
Data included in this report reflects student assessment results from the first few weeks after they returned to school for the 2021-22 school year. iReady was administered from early September through mid-November. This is not an assessment of Quarter 1 progress.
Also, be aware that iReady is only one type of academic data used to understand student learning progress and division performance.
FCPS is directing significant ESSER funding aimed at supporting our students in reading and math to ensure gaps are addressed. These include after-school tutoring, individualized tutoring during the school day, and English Language Development time.
February 2022: The baseline ESSER accountability report is scheduled for a Board Work Session regarding ESSER III monitoring. The focus of this baseline report is to understand identification of students for intervention and supports in reading and mathematics and the extent to which there is alignment with ESSER III fund allocation.
Fairfax County Public Schools and National Comparisons
Students Performing On-Grade Level in Fall, iReady Pre- and Post-Pandemic Outcomes
Mathematics iReady
|
Mathematics |
Grade 1 |
Grade 2 |
Grade 3 |
Grade 4 |
Grade 5 |
Grade 6 |
|---|---|---|---|---|---|---|
|
National Historical |
12% |
15% |
18% |
29% |
33% |
33% |
|
National Fall 2021 |
10% |
13% |
13% |
19% |
23% |
25% |
|
Fairfax Fall 2019 |
19% |
28% |
29% |
46% |
52% |
58% |
|
Fairfax Fall 2021 |
19% |
23% |
25% |
34% |
40% |
47% |
Reading iReady
|
Reading |
Grade 1 |
Grade 2 |
Grade 3 |
Grade 4 |
Grade 5 |
Grade 6 |
|---|---|---|---|---|---|---|
|
National Historical |
18% |
29% |
44% |
31% |
30% |
31% |
|
National Fall 2021 |
16% |
24% |
40% |
29% |
29% |
29% |
|
Fairfax Fall 2019 |
27% |
34% |
50% |
33% |
31% |
34% |
|
Fairfax Fall 2021 |
27% |
32% |
46% |
32% |
32% |
37% |
Data Notes: In these graphs and tables, on-grade level performance is defined using iReady’s nationally normed placement levels. This value reflects students performing in the “Early On-Grade” or the “Mid On-Grade or Above” placement level during fall testing. The pre-pandemic “National Historical” data represents a pooled average across fall 2017, fall 2018, and fall 2019 for the same cohort of schools nationwide. All data are compliments of Curriculum Associates, the designer of the iReady assessment.
Fairfax County Public Schools and National Comparisons
Mean Scaled Score in Fall, iReady Pre- and Post-Pandemic Outcomes
Mathematics iReady
|
Mathematics |
Grade 1 |
Grade 2 |
Grade 3 |
Grade 4 |
Grade 5 |
Grade 6 |
|---|---|---|---|---|---|---|
|
National Historical |
375 |
401 |
425 |
447 |
465 |
477 |
|
National Fall 2021 |
371 |
395 |
418 |
439 |
456 |
469 |
|
Fairfax Fall 2019 |
376 |
407 |
433 |
461 |
479 |
498 |
|
Fairfax Fall 2021 |
376 |
401 |
426 |
449 |
467 |
488 |
Reading iReady
|
Reading |
Grade 1 |
Grade 2 |
Grade 3 |
Grade 4 |
Grade 5 |
Grade 6 |
|---|---|---|---|---|---|---|
|
National Historical |
401 |
457 |
495 |
526 |
549 |
566 |
|
National Fall 2021 |
397 |
446 |
486 |
520 |
543 |
560 |
|
Fairfax Fall 2019 |
407 |
462 |
502 |
533 |
552 |
571 |
|
Fairfax Fall 2021 |
408 |
455 |
495 |
525 |
547 |
570 |
Data Notes: In these graphs and tables, the mean scaled score reflects average student performance on iReady’s nationally normed scale. Fall scaled scores provide a baseline for calculating growth between test administrations, such as from fall to spring or one year to the next. The pre-pandemic “National Historical” data represents a pooled average across fall 2017, fall 2018, and fall 2019 for the same cohort of schools nationwide. All data are compliments of Curriculum Associates, the designer of the iReady assessment.
Next Steps and Use of Federal Pandemic Relief Funding (ESSER)
$188.6 million of ESSER Funds allocated to FCPS for expenses related to the pandemic.
The grant funding requires the spending be focused in four areas. A portion of the federal aid must be spent tackling learning loss:
- Unfinished learning
- Student academic, social, emotional, and mental health/wellness needs
- Prevention and mitigation strategies
- Technology, multilingual engagement and equity needs
The majority of the ESSER III spending (82%) will address learning loss and student academic, social, emotional, and mental (wellness) health needs, which students need in order to learn.
- Unfinished learning 40.5%
- Student academic and social, emotional and mental health needs 41.8%
- Academic interventions 29%
FCPS, like many school divisions, will be offering proven strategies like targeted intensive tutoring, which works well for younger students and increasing the number of hours of instruction students receive each day during nonacademic class periods.
It also includes additional financial support for special education teachers whose scheduled daily work hours have been increased to support the additional workload they have been required to carry during the pandemic.
Funds have also been set aside for an additional year of enhanced summer school in the summer of 2022.
School-Specific Strategies and Supports
Each school has received funding allocations as well as stipends, for academics and wellness. The academic and wellness allocations are to be used to directly support students. The amount each school received is based on its enrollment and need, determined by the number of students eligible for free and reduced meals; percent of English Learners; percent of Students with Disabilities; reading and mathematics achievement reverse index; and graduation and Completion Index (for high schools).
The funding will be used to support academics and wellness, including:
- Tutors
- Monitors to support school services
- Additional instruction for students in need of hands-on and other preparatory learning for industry credentials and Career and Technical course completion
- Additional English for Speakers of Other Languages (ESOL)
- Transportation for before school, after school, and Saturday programs
- Family engagement
- Materials and programs
- Hourly pay for teachers for tutoring services
- Professional development
- Additional collaborative planning time
- Classroom monitors.
All school “at-a-glance” plans have been posted to their school websites.
