Student Rights and Responsibilities (SR&R) 2023 Community Survey Results
A summary of the feedback received from staff, students, and parents/guardians on proposed changes to the SR&R.
Fairfax County Public Schools is in the process of updating the Student Rights and Responsibilities (SR&R) document for the 2023-24 School Year. This comprehensive, anonymous, and voluntary survey gave staff, students, parents/guardians an opportunity to provide feedback on proposed changes to the SR&R.
Our goal is to ensure every student's right to an education in a safe, civil, and caring environment. The SR&R supports this stance by providing clear expectations for student behavior, responses to that behavior, and supports that may be needed. The results provide a snapshot of the respondents, based on: Race/Ethnicity; specific connection to FCPS- to include roles within FCPS; and specific services received within the FCPS system. This survey serves as a barometer of the community's support of the SR&R and the proposed changes to the SR&R.
SR&R Survey Results
Executive Summary
This report summarizes the results of the 2023 Fairfax County Staff/Community SR&R Survey. The survey examined the levels of support for SR&R in general and the proposed changes for the upcoming 2023-24 school year. The participation in this survey was voluntary and anonymous. The survey results will help FCPS make informed decisions and provide the necessary supports to our students so that they can thrive in the academic environment. FCPS remains committed to listening to its residents/stakeholders and understanding your opinions and experiences in key areas.
Key Findings
Which of the following best describes your role in FCPS?
13,148 responses
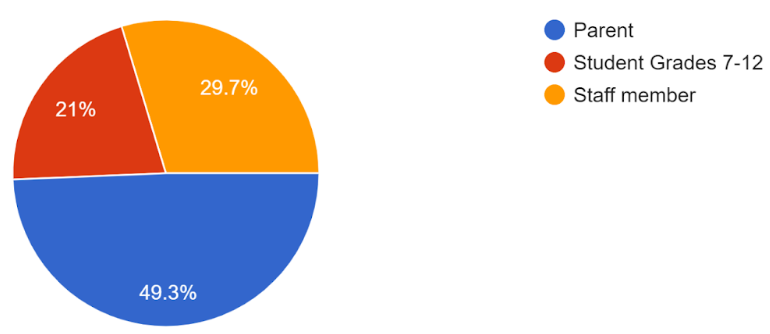
Out of approximately 13,148 responses to the survey, 49.3% were parents/guardians; 29.7% were FCPS staff members; and 21% were students grades 7-12th (Figure 1).
I am the parent/guardian of student(s) in the following grade levels:
6,474 responses
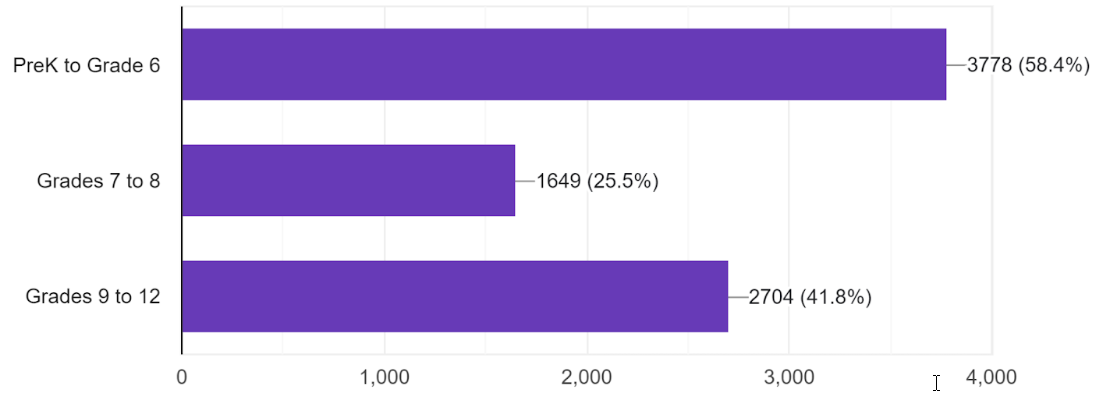
58.4 % of the respondents were representative of a parent/guardian of a child in PreK- grade 6, 41.8% of the respondents were representative of a parent/guardian of a child in grades 9-12, and 25.5% of the respondents were representative of a parent/guardian of a child in grades 7-8 (Figure 2).
Is your child Hispanic of Latino/Latina?
6,336 responses
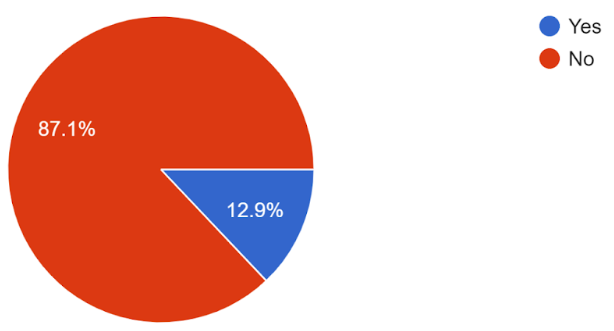
Out of 6,336 responses to the question: Is your child Hispanic of Latino/Latina? 87.1% of the respondents reported No, while 12.9% reported Yes (Figure 3)
What is your child’s race?
6,115 responses
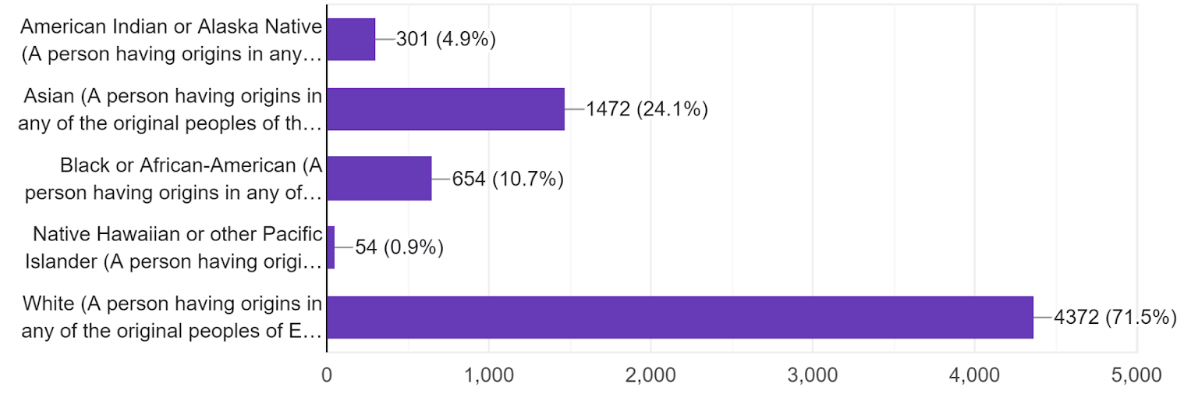
Out of 6,115 responses to the question: What is your child’s race? 71.5% reported as White, 24.1% reported as Asian, and 10.7% reported Black (Figure 4).
Does your child receive special education services?
6,439 responses
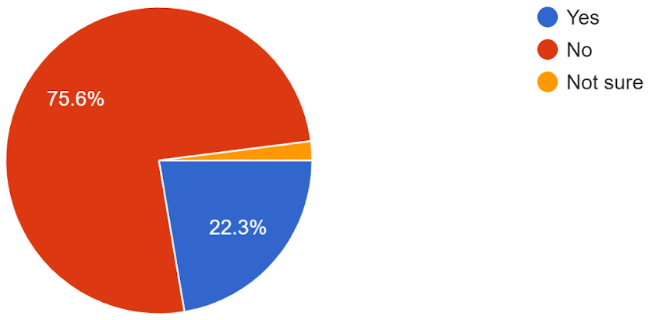
Out of 6,439 responses to the question: Does your child receive special education services? 75.6% reported No, while 22.3% reported Yes (Figure 5).
Does your child receive English for Speakers of Other Languages (ESOL) services?
6,442 responses
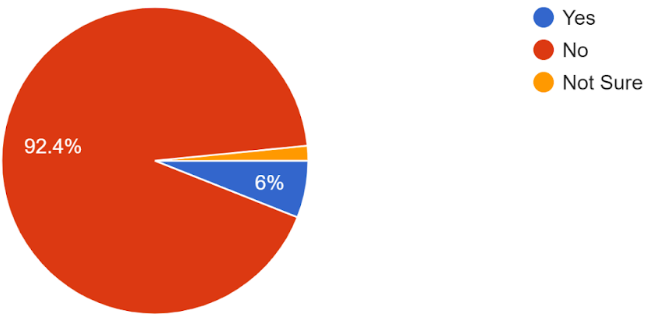
Out of 6,442 responses to the question: Does your child receive English for Speakers of Other Languages (ESOL) services? 92.4% reported No, while 6% reported Yes (Figure 6).
I am an FCPS student in what grade?
2,756 responses
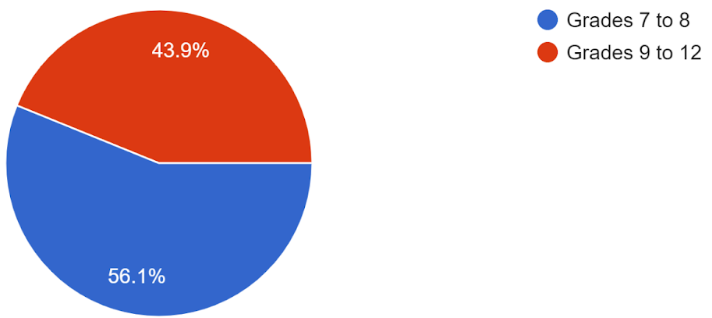
Out of 2,756 responses to the question: I am an FCPS student in what grade? 56.1% reported to being in grades 7-8th, while 43.9% reported to being in grades 9-12th (Figure 7).
What best describes the school level at which you work?
3,883 responses
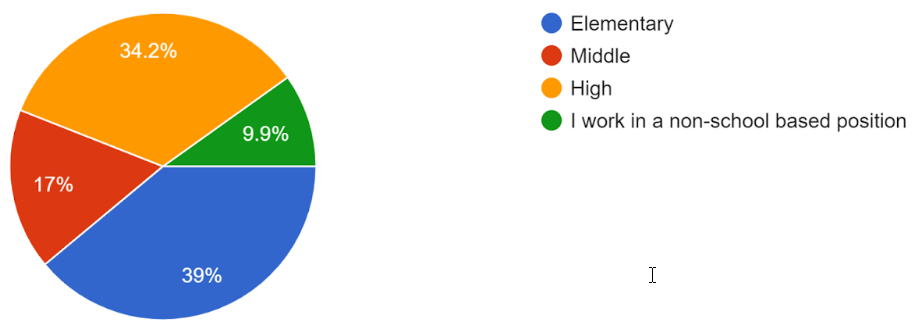
Out of 3,883 responses to the question: What best describes the school level at which you work? 39% reported the Elementary level; 34.2% High School level; 17% reported Middle School level; and 9.9 % reported they in a Non-School based position (Figure 8).
What best describes your role in FCPS?
3,884 responses
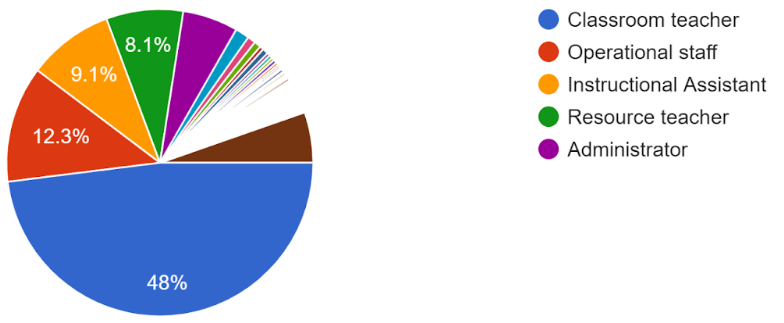
When asked, What best describes your role in FCPS? There were 3,884 responses. Out of those responses, 48% reported Classroom Teacher; 12.3% reported Operational Staff; 9.1% reported Instructional Assistant; and 8.1% reported Resource Teacher (Figure 9).
To what extent are you supportive of the proposes changes to student dress code in the SR&R?
12,932 responses
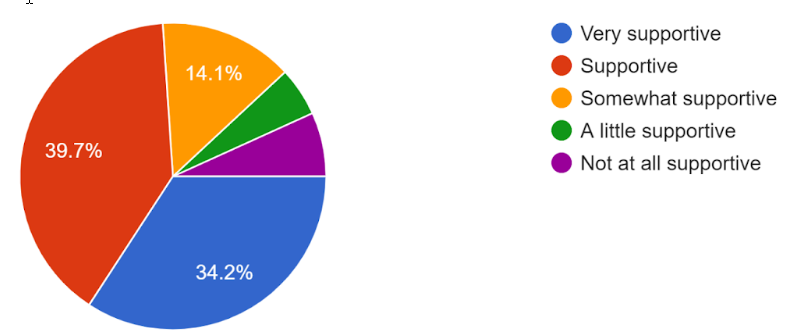
Out of 12,932 responses to the question: To what extent are you supportive of the proposes changes to student dress code in the SR&R? 39.7% stated they are Supportive of the proposed changes. There were 34.2% of the respondents that reported to be Very Supportive of the proposed changes, and 14.1% stated they are Somewhat Supportive (Figure 10).
To what extent are you supportive of FCPS’ approach to student dress code in the SR&R?
12,898 responses
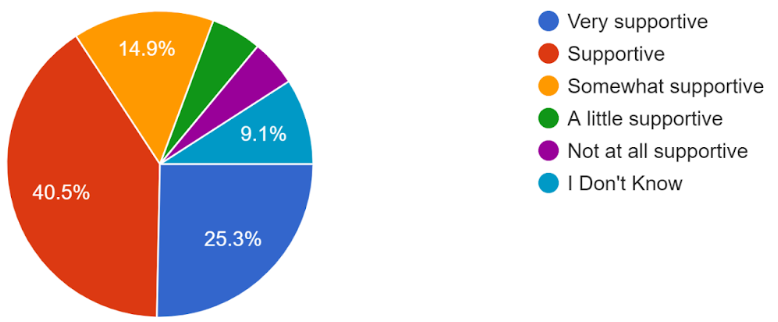
Out of 12,898 responses to the question: To what extent are you supportive of FCPS’ approach to student dress code in the SR&R? 40.5% reported Supportive; 25.3% reported Very Supportive; and 14.9% reported Somewhat Supportive (Figure 11).
To what extent are you supportive of the proposed changes to the substance misuse section of the SR&R?
12,821 responses
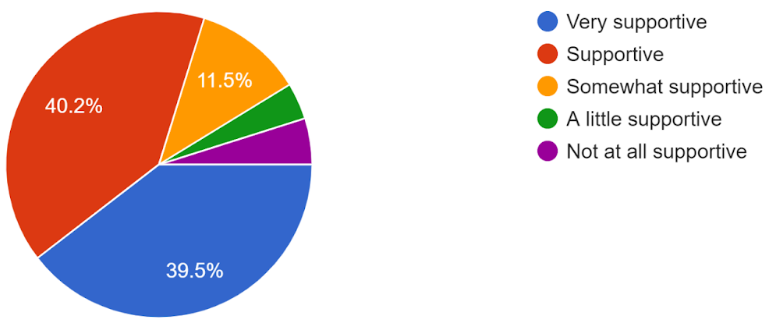
Out of 12,821 responses to the question: To what extent are you supportive of the proposed changes to the substance misuse section of the SR&R? 39.5% reported Very Supportive; 40.2% reported Supportive; and 11.5% reported Somewhat Supportive (Figure 12).
To what extent are you supportive of FCPS’ overall approach to substance misuse in the SR&R?
12,793 responses
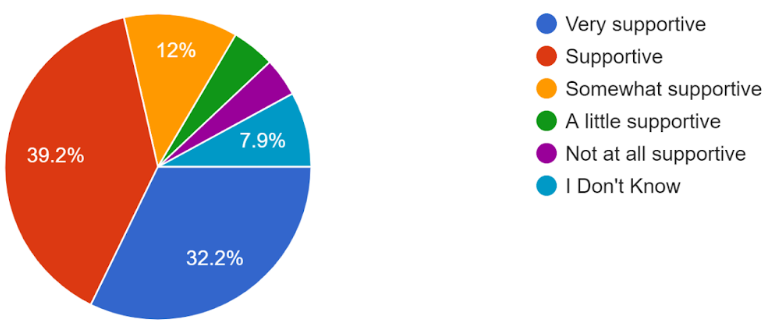
Out of 12,793 responses to the question: To what extent are you supportive of FCPS’ overall approach to substance misuse in the SR&R? 39.2% reported Supportive; 32.2% reported Very Supportive; 12% reported Somewhat Supportive; and 7.9% reported I Don’t Know (Figure13).
To what extent are you supportive of the proposed changes to addressing discriminatory harassment in the SR&R?
12,916 responses
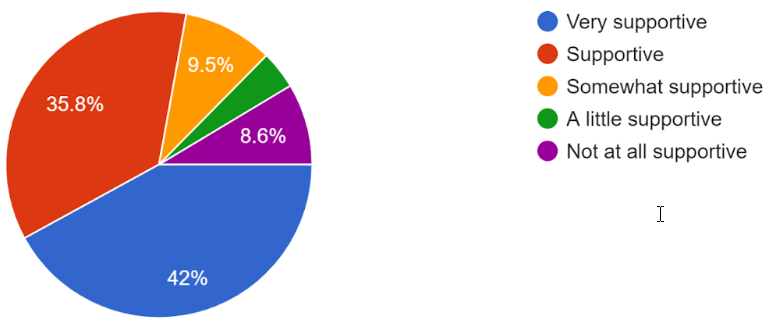
Out of 12,916 responses to the question: To what extent are you supportive of the proposed changes to addressing discriminatory harassment in the SR&R? 42% reported Very Supportive; 35.8% reported Supportive; 9.5% reported Somewhat Supportive; and 8.6% reported Not at All Supportive (Figure 14).
To what extent are you supportive of FCPS’ overall approach to addressing discriminatory harassment in the SR&R?
12,830 responses
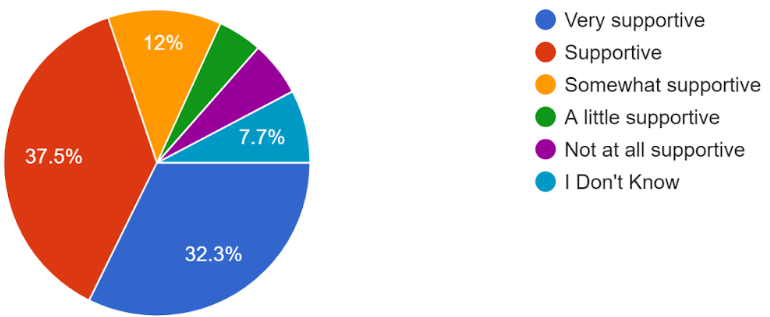
Out of 12,830 responses to the question: To what extent are you supportive of FCPS’ overall approach to addressing discriminatory harassment in the SR&R? 37.5% reported Supportive; 32.3% reported Very Supportive; 12% reported Somewhat Supportive; and 7.7% reported I Don’t Know (Figure 15).
To what extent are you supportive of the proposed changes to the hazing section of the SR&R?
12,768 responses
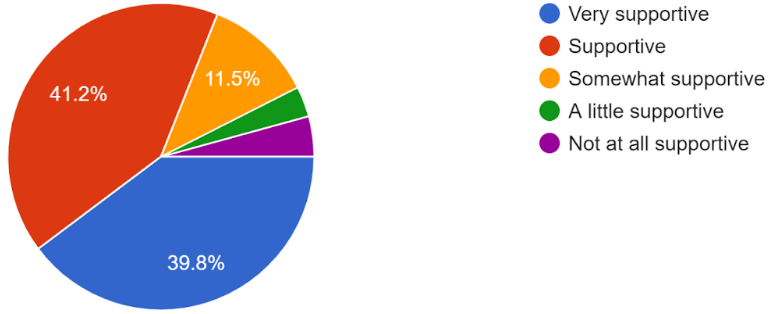
Out of 12,768 responses to the question: To what extent are you supportive of the proposed changes to the hazing section of the SR&R? 41.2% reported they are Supportive; 39.8% reported Very supportive; and 11.5% reported Somewhat Supportive (Figure 16).
To what extent are you supportive of FCPS’ overall approach to the hazing in the SR&R?
12,676 responses
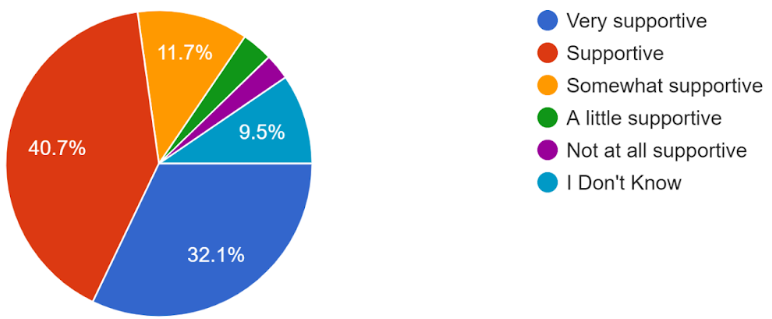
Out of 12,676 responses to the question: To what extent are you supportive of FCPS’ overall approach to the hazing in the SR&R? 40.7% reported they are Supportive; 32.1% reported Very Supportive; 11.7% reported Somewhat Supportive; and 9.5% reported I Don’t Know (Figure 17).
To what extent are you supportive of the proposed changes to the bullying section of the SR&R?
12,805 responses
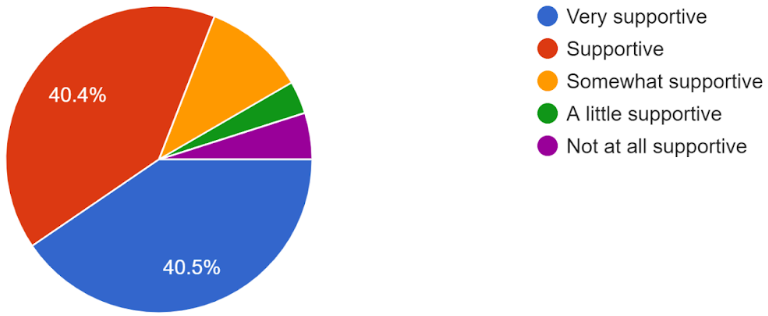
Out of 12,805 responses to the question: To what extent are you supportive of the proposed changes to the bullying section of the SR&R? 40.5% reported as being Very Supportive; and 40.4% reported being Supportive (Figure 18).
To what extent are you supportive of FCPS’ overall approach to bullying in the SR&R?
12,735 responses
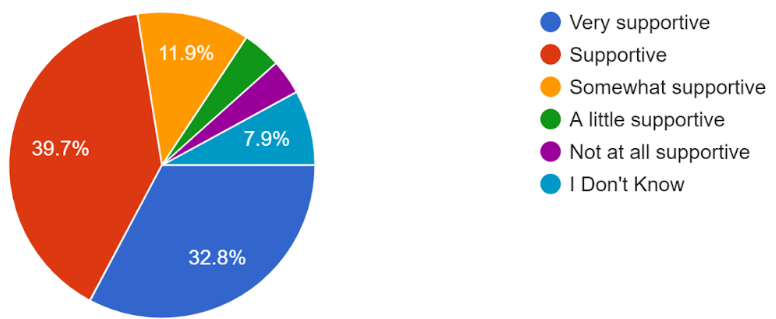
Out of 12,735 responses to the question: To what extent are you supportive of FCPS’ overall approach to bullying in the SR&R? 39.7% reported as being Supportive; 32.8% reported being Very Supportive; 11.9% reported being Somewhat Supportive; and 7.9% reported I Don’t Know (Figure 19).
To what extent are you supportive of the proposes changes to the cell phone section of the SR&R?
12,939 responses
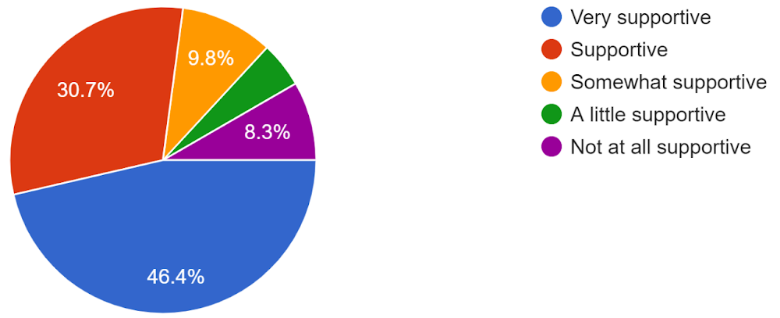
Out of 12,939 responses to the question: To what extent are you supportive of the proposes changes to the cell phone section of the SR&R? 46.4% of the respondents reported to be Very Supportive; 30.7% reported to be Supportive; 9.8% reported to be Somewhat Supportive; and 8.3% reported to be Not at All Supportive (Figure 20).

Proposed Updates to the Student Rights and Responsibilities (SR&R) Document
FCPS is in the process of updating the Student Rights and Responsibilities document for the 2023-24 School Year.

Student Safety and Wellness
From mental health resources to bullying prevention and food and nutrition services, FCPS is committed to supporting more than just a child's education. Includes information on mental health resources, school health services, our wellness policy, and student safety.


